
Stocks ended mixed to mostly lower in Q1 2018 as volatility returned with a vengeance. The VIX, a popular measure of market volatility, surged in the first quarter and marked one of its largest quarterly advances in history. The Dow Jones Industrial Average, benchmark S&P 500, and small-cap Russell 2000 all ended the quarter and year in the red as the tech-heavy Nasdaq Composite ended slightly higher.
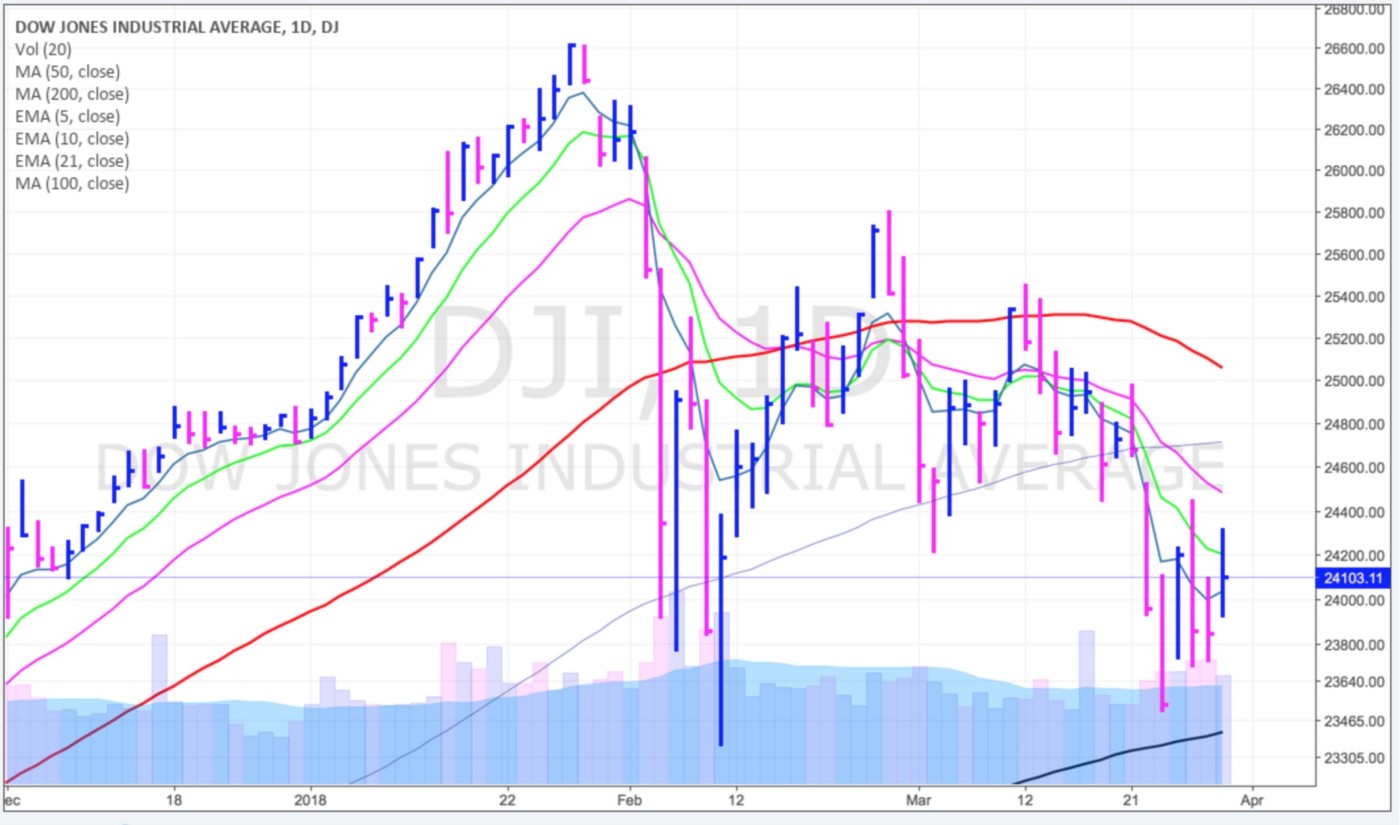
The big concern that I have is that all this “selling” and “volatility” is happening in an aging bull market. Imagine what will happen in the next bear market! The good news is that the fundamental outlook remains bullish as both earnings and the economy are set to grow nicely for the rest of 2018 and 2019. At this point, the next important level to watch is the 200 DMA line then Feb’s low. If those levels are breached we have to expect lower prices to follow. Conversely, if those levels hold, sideways/higher prices will likely follow.
It is also important to note that stocks have a slight upward bias during the first two weeks of April. On average, the market tends to rally over 1% in the first two weeks of April which is much stronger than the 0.2% gain experienced during the first two weeks of the other months.
A CLOSER LOOK AT WHAT HAPPENED LAST WEEK…
Mon-Wed Action:
 On Monday, stocks soared nearly 700 points in one of the largest single-day rallies in history after concern eased about the so-called trade-war between the U.S. and China. The Financial Times reported China has offered to buy more semiconductors from the U.S. to help cut its trade surplus with the U.S and that senior officials from both sides were actively discussing a feasible solution. Technically, the bulls showed up and defended the longer-term 200 DMA line for the S&P 500 which has served as important support since the 2016 election. Stocks opened higher but closed lower on Tuesday as investors digested Monday’s monstrous rally. Tech stocks fell after Reuters reported that Nvidia will temporarily suspend self-driving tests. This came after a few fatal accidents in recent months from self-driving vehicles.
Stocks fell on Wednesday as the tech-heavy Nasdaq composite fell for a second straight day. Shares of Amazon got smacked after President Trump tweeted that he wants to go after them and change the way they are taxed. Other tech stocks were under pressure as investors sold tech stocks after they recently hit new highs.
Thur & Fri Action:

On Thursday, stocks rallied nicely on the last trading day of the month and the quarter. Shares of Facebook jumped over 4% as value investors stepped in and bought the latest dip. Other tech giants also rallied as investors jumped back into tech stocks after Microsoft announced a major reorganization. Stocks were closed on Friday in observance of Good Friday.
Market Outlook: Bulls Try To Defend Support
The market is trading between important resistance (2018’s high) and important support (February’s low). Until either level is broken, I have to expect this sloppy, sideways action to continue. The big level of support to watch is February’s low and the 200 DMA line for the major indices. For now, as long as those levels hold, the longer-term uptrend remains intact. As always, keep your losses small and never argue with the tape.


