

Stocks Breakout Of Bullish Head and Shoulders Pattern
Stocks rallied nicely last week and are once again flirting with major resistance (record highs) after the government reported a stronger than expected jobs report. The bullish fundamental catalyst is that Brexit means more easy money from global central banks and (for now) and that is bullish for stocks. U.S. employers added 287,000 new jobs in June, easily beating estimates for 180,000. The major indices have now erased the entire Brexit sell-off which illustrates how the strong underlying bid is in the market. The major indices broke above the neckline of a short head and shoulders continuation pattern. Since the Feb 11 low, every pullback in the major indices has been short in both size (small percent decline) and scope (short in duration). That’s healthy action as the major indices refuse to budge on the downside.
Now, some are saying the central banks are in there directly buying stocks (and we do not disagree) but we don’t care why the market is going up or down, we only care about what the market is doing. Two days after the Brexit sell off, Mario Draghi (European Central Bank President) said global central banks need to do more and that triggered a huge wave of buying from investors. Two days later, Mr. Carney, the head of the Bank of England, came out and said the Bank of England will provide more easy money which was a confirmation that the easy money party is here to stay. We also want to note that the market is now back near resistance and every time the market has traded at these levels over the past year and change, we have seen sellers show up and send stocks lower. Eventually, the market will breakout (and close) of range (above resistance 2134) or below support 1810) but until then, we are still range-bound. The fact that we continue to “test” resistance suggests it is only a matter of time until the market breaks out and begins a new leg higher.
A Closer Look at What Happened Last Week
[su_horizontal_ads]
Monday-Wednesday’s Action:
U.S. stocks were closed on Monday in observance of independence day. Overseas markets fell as fresh concern spread regrading Brexit. On Monday, the European Central Bank opened the door to state aid for euro zone banks. Italy was back in focus when they entered into to talks with the European Commission to recapitalize their banks with public money. On Tuesday, stocks sold off after the British Pound broke below last week’s low and continued to drag other markets lower. Shares of European banks fell hard as investors were worried about their ability to stay solvent in a post Brexit world. In other news, Bond yields continued to plunge across the world.
Thursday & Friday’s Action:
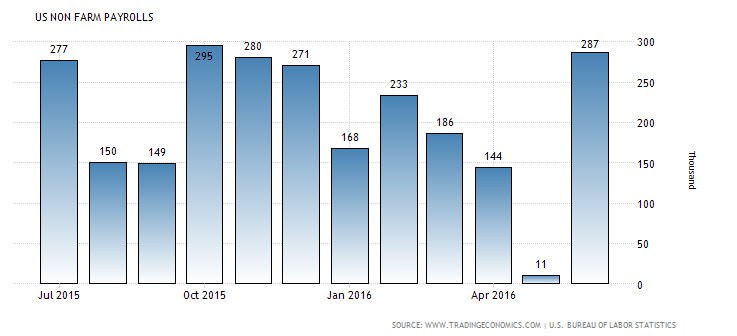 Stocks were relatively quiet on Thursday as investors waited for Friday’s always fun jobs report. Before the open, ADP, the country’s largest private payrolls company, said U.S. employers added 172,000 new jobs in June, beating estimates for 150,000. A separate report showed that weekly jobless claims slid by 16,000 to 254,000 last week, beating estimates for 269,000. Stocks rallied nicely on Friday after the government said U.S. employers added 287,000 new jobs, easily beating estimates for 180,000.
Market Outlook: Stocks Flirt With Resistance
The market is once again flirting with stubborn resistance (recent highs) but the action remain strong. Economic and earnings data remain less than stellar which could mean more easy money from global central banks. As always, keep your losses small and never argue with the tape.
Always be on the right side of the market. Take a FREE 30 Day Trial of Advanced Reports.
 Adam Sarhan is a 20+ year market veteran, a Forbes contributor, and is regularly quoted in financial media. Watch his recent appearance on Bloomberg TV here. Adam is the Founder & CEO of Sarhan Capital.
Advanced Reports Members Receive:
- Model Portfolio: receive our game plan ahead of time with exact entry and exit points. Follow our exact moves and learn how money is made on Wall Street.
- Market Overview: explains and analyzes all of the key news, events, themes, and drivers of the market. Here we discuss where we’ve been, and where we’re ultimately heading
- Professional Ready List: hand picked leading stocks that are ready to breakout in bull markets or break down in bear markets. Whether its the bull side or the bear side, we’ll help keep you on the right side of the market.
- Conviction Leaders List: always know which stocks are leading the market. This list is broken down by market cap and provides you with the stocks making the strongest gains YTD.
- 3 Reports per Week Sent Straight to Your Inbox and archived on ChartYourTrade
- Weekend Report
- Intra-Week Updates sent on Tuesday and Thursday
- Unlimited Direct Email Access to Adam Sarhan is like having a trading partner with you ever step of the way


