
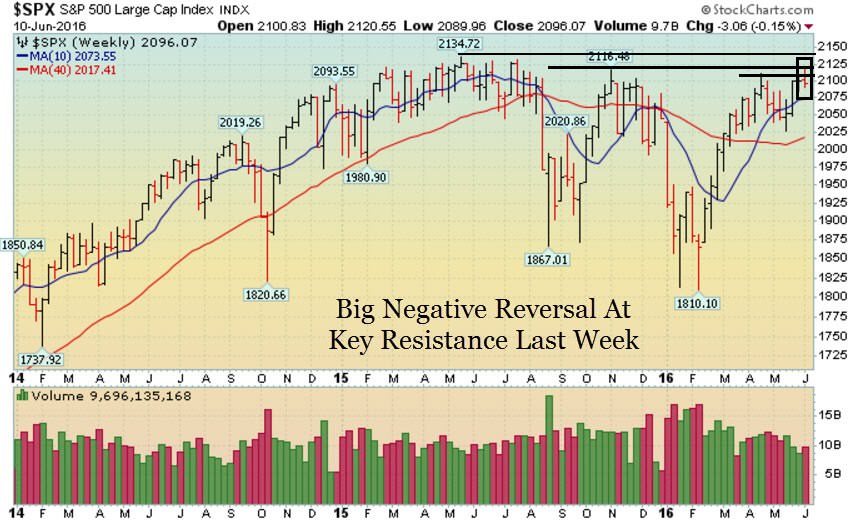
Stocks Fail At Key Levels of Resistance
It was a tough week for the bulls. Stocks opened higher but closed near the lows for the week after failing to stay above key levels of resistance. For the past few weeks, we outlined April’s high of 2,111 in the S&P 500 as an important area to watch. Well, the market jumped above that level early in the week but closed below there by Friday. The other big level of resistance was November 2015’s high of 2,116 and the market briefly got above there on Thursday but immediately sold off and closed below that important level on Friday. Technically, that is another negated breakout which frustrates both the bulls and the bears. On the downside, we are watching the 50 day moving average (2,076) and then May’s low near 2026.
In the short term, the market is a little extended and it would be perfectly normal to see it pullback a bit to digest the recent rally. The “big” level of resistance to watch remains last year’s record high of 2,134. Until we break above that level- we have to expect this sloppy and choppy sideways action to continue. On the downside, the “big” level of support remains 1810. Until either level is breached, we have to expect this sloppy action to continue. Finally, the Fed meets on Wednesday (meeting and press conference) which is the next big “data” point for investors.
Monday-Wednesday’s Action:
Stocks rallied nicely on Monday helping the Dow Jones Industrial Average and benchmark S&P 500 jump above near term areas of resistance and hit new highs for the year. Janet Yellen spoke on Monday and said Friday’s tepid Jobs Report created economic uncertainty which reduced the chance of a June rate hike. Oil stocks were front and center on Monday as oil prices jumped over 2% on fresh supply concerns out of Nigeria. The S&P 500 traded at the highest level since July before it backed off and closed in the middle/to lower half of its daily range. Buyers showed up and sent oil, transportation and housing stocks higher helping them break above near term areas of resistance. Economic data was relatively light. First quarter productivity (which measures hourly output per worker) slid to an annualized rate of 0.6%, lower than the 1.0% rate reported last month. Unit labor costs which measures the price of labor per single unit of output, rose at an upwardly revised 4.5% rate.
Stocks rallied on Wednesday as the strong sector rotation we have outlined for you in recent weeks continued. On Wednesday, we saw big money flow into commodities, mainly steel, oil and gold stocks. Other sectors of the market also did well such as materials, transports, and industrials. Crude oil jumped above $51/barrel and gold prices vaulted $17 to 1264/ounce. Before the open, the World Bank downgraded its 2016 global growth forecast to 2.4% from the 2.9% forecast in January but markets largely dismissed the news. Elsewhere, the European Central Bank (ECB) began buying corporate bonds in its latest effort to stimulate markets. After Wed’s close, the WSJ reported that legendary investor, George Soros, is bearish on stocks and is trading again. The last time he did this was in 2007 and we all know what happened in 2008.
Thursday & Friday’s Action:
Stocks opened lower on Thursday as the US dollar soared. Overnight, stocks in Asia and Europe fell over 1% as sellers showed up after a nice two week rally. After Europe closed, buyers showed up and helped the major indices rally off their lows. Remember, we had a big run since May 19 and it is perfectly normal to see the market pull back a little to digest that strong rally. In other news, The European Central Bank (ECB) began its corporate bond purchase program on Wednesday. ECB President Mario Draghi spoke on Thursday and warned of “lasting economic consequences” for the next few years because of tepid economic output. Stocks opened lower on Friday after government bond yields plunged across the globe. Friday was the first “real” day of heavy selling we have seen in weeks – we have to see if it continues.
Market Outlook: Stocks Fail At Key Resistance
The market remains range-bound as it tries to breakout and hit fresh record highs. Economic and earnings data remains less than stellar but all that matters now- is the easy money from global central banks. As always, keep your losses small and never argue with the tape.
Need help with the market? Take a FREE 30 Day Trial of Advanced Reports.
 Adam Sarhan is a 20+ year market veteran, a Forbes contributor, and is regularly quoted in financial media. Watch his recent appearance on Bloomberg TV here. Adam is the Founder & CEO of Sarhan Capital.
Advanced Reports Members Receive:
- 3 Reports per Week Sent Straight to Your Inbox and archived on ChartYourTrade
- Weekend Report
- Intra-Week Updates sent on Tuesday and Thursday
- Model Portfolio along with a game plan defining where to enter and where to exit
- Market Overview highlighting key news and events, where we’ve been, and where we’re heading
- Professional Watch List of stocks ready to breakout in bull markets or break down in bear markets
- Conviction Leaders List of stocks which are leading the market broken down by market cap
- Unlimited Direct Email Access to Adam Sarhan is like having a trading partner with you ever step of the way


