Welcome to the worst month of the year.

Facebook
Twitter
LinkedIn

Courtesy of LPL Research: 

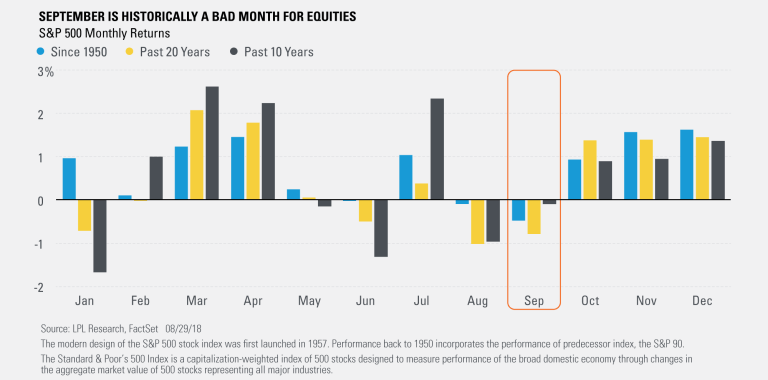
Well, here it comes—September. It’s widely considered the worst month of the year for equities for good reason, since it has historically performed the worst. Per Ryan Detrick, senior market strategist, “September is the banana peel month, as some of the largest slips tend to take place during this month. Although the economy is still quite strong, and stocks are marking hew highs, this doesn’t mean some usual September volatility is out of the question—in fact, we’d be surprised if volatility didn’t pick up given midterm years tend to see big moves in the months leading up to the November election.”

Here’s some data to consider as September approaches:

  • Since 1950, no month sports a lower average return than September, with the S&P 500 Index down 0.47% on average. June and August are the only other months that are generally in the negative, while November and December tend to be the strongest months of the year.
  • In the past 20 years, September has been the second-worst month, with only August fairing worse. More recently, over the past 10 years, it’s still down on average but comes in at the fifth-worst month.
  • The worst September ever for the S&P 500 was a 30% drop in 1931. In fact, no other month has had more 10% drops than September, at seven. Interestingly, January is the only month that has never been down 10% or more.
  • Since 1950, if the S&P 500 starts September above its 200-day moving average (like 2018 will), it tends to do much better, as it is up 0.4% on average versus down 2.7% if it starts the month below the 200-day moving average.

Last, as we shared last week, when the S&P 500 is up in the five months heading into September (like 2018), the month has historically done quite well, up 2.3% on average and higher four out of five times since 1950.


Source: https://lplresearch.com/2018/09/04/the-worst-month-of-the-year/

Facebook
Twitter
LinkedIn

Here are more articles you may like

Claim Your Free Guide Today

Give us your email and we will give you the tools to change your life. 

FREE 7 DAY EMAIL COURSE

Learn about Early Entry Points & much more...

© ChartYourTrade | Contact us: website@chartyourtrade.com

Disclaimer: All communication from ChartYourTrade is general in nature and for educational and general informational purposes only. Under no circumstance should it be considered personalized investment advice. All our work is general in nature and not specific to any one person. All the information on this site and/or that originates from us, or any of our partners or affiliates, is for educational and informational purposes only and is NOT a recommendation to buy or sell anything. To avoid any conflicts of interest, we do not have a working relationship with any of the companies mentioned in our work. Furthermore, we may have a long, short, or no position in any, or all, of the names that appear in our work and they may change at any time without notice. Investing and trading in capital markets or using margin carries a high level of risk and may not be suitable for all investors. Leverage can work against you as well as for you. Before you decide to invest or trade in capital markets you should carefully consider your investment objectives, level of experience, and risk appetite, among other factors. The possibility exists that you could sustain a loss of some, all, or more of your initial investment and therefore you should not invest money that you cannot afford to lose. You should be aware of all the risks associated with capital markets, investing/trading, and seek specific investment advice from an independent financial advisor and other professionals. Remember all the information we provide is for educational and general informational purposes only and is subject to change without notice.

Charts and Data are courtesy of MarketSmith Incorporated. Join MarketSmith here.

Terms of Service