
Implied volatility is one of the most important concepts when trading options. In this article, we’ll try to understand a little bit more why it is important and how to use it when trading to increase our profits. Implied volatility is a ‘plug number’ (a placeholder number used to make the calculation estimate correct) used to make the result from the black and Scholes formula equal to the market price. IV has major impact on trading, and to simplify this idea, let’s look at an example:
- Stock A is priced at $100 and has high implied volatility. Let’s say that the call strike 100 costs $4.
- Stock B is also priced at $100 but has low implied volatility. Let’s say that the call strike 100 costs $1.
When comparing the two trades, we can see that the break even point of stock A is $104 and for stock B is $101. This means that we have an increase of 1% to show profit in stock B, but 4% in stock A. Furthermore, if we assume a similar increase, let’s say 5% in each stock (by expiration) – we can see that we will have $1 profit in stock A but a $4 profit in stock B. The following Table summarizes the two scenarios:
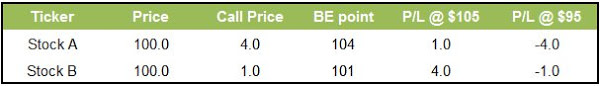
Compare high and low implied volatility scenarios
To put it simply: When IV is low it’s easier to profit and your profits are higher (for buyers) and when IV is high it is harder to profit and the profit is lower. Of course, it is vice-versa for option sellers.
Sometimes, however, higher IV is justified – mainly due to stock volatility/conditions or market conditions. For example: NFLX volatility is twice as high (when compared in percentage) compared to WMT. We can expect the IV and the options premium to reflect that as well.
An analogy could be done to the PE ratio – most of the time a company deserves a high or low PE ratio. But when it’s extreme it usually is a contrarian sign.
So, How do we know if IV is high or low? and more importantly – How do we know if the odds are in our favor? We can use IV Percentile (Rank):
IV Rank
![]()
IV Rank (percentile) is a measurement of stock IV. For example: If a stock has IV Rank of 92.5%. This means that over the last 200 days 92.5% of the days had lower IV than the current one. Or to put it simply: The current IV is high.
Similarly – If a stock has an IV rank of 15% (like AAPL in the picture above) only 15% of the days had lower IV. This means the IV is low.
You can find the calculation easily in our options scanner and even find results for a specific stocks in our free demo.
These calculations have several characteristics:
- It is fluctuating between 0-100
- It is mean reverting (after a high value you can expect a lower value in higher probability)
- If the IV rank is high – it is more favourable towards options selling.
- If the IV rank is low – it is more favourable towards options buying.
AAPL Example:
The following charts display AAPL IV starting Jan 2013 till June 2015. The first chart shows AAPL IV, The second chart shows AAPL IV rank and the third charts shows both of them together:
Chart I: AAPL IV –
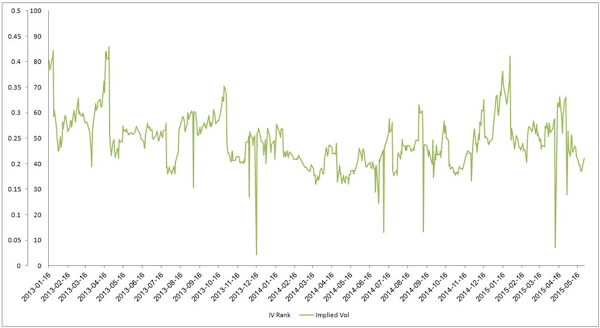
Chart II: AAPL IV rank –
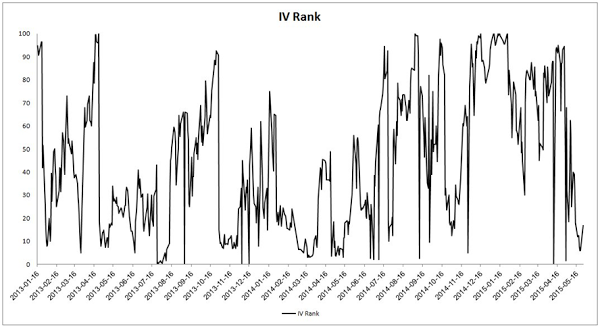
Chart III: AAPL IV (green) Vs. AAPL IV Rank (black):

When we look at the first chart, we see that it is easy to see the high and lows in IV, but it is only in hindsight. Chart II shows us the IV rank, and we can see that it is (1) much more volatile and (2) easier to see when value is high or low since the indicator is capped. This makes the indicator easier to trade and profit from.
[su_horizontal_ads]
Can we use and profit from IV rank?
We have tested IV rank on indexes and on major stocks and we can see that this calculation is mean-reverting, meaning – After high IV Rank we can expect a decrease in IV – and vice verse.
Here are results on 5 highly liquid blue chip stocks:
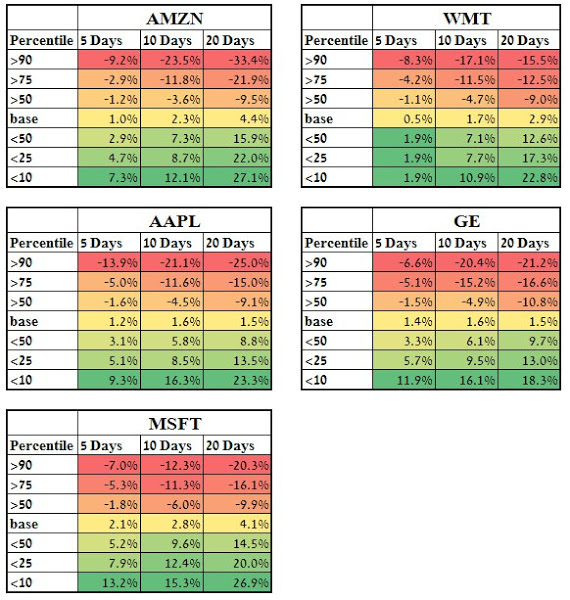
In these tables, we can see for example in Microsoft ($MSFT) that after an IV rank of 90 or higher we can expect a 7% decrease over the next 5 days. We can compare it to a rise in IV of 2.1% on average or 13.2% when IV rank is lower than 10%.
If we know that IV rank is mean reverting it helps us plan our trades: for example – if we see high IV rank we want to use strategies that profit from decrease in IV such as selling options. And vise verse: if we see low IV – for example 10 – we can expect a rise in volatility and might consider buying options.
Using IV rank on Option Samurai:
There are 2 main ways you can use IV rank in Option Samurai:
- In the Market sentiment widget
- In the scan page attached gif:
These features are available in our free price tier as well.
Read more:
- what is IV percentile
- The edge of IV percentile
- The difference between IV rank & IV Percentile
- More research into Implied Volatility (from the blog)
Option Samurai is designed to give individual investors an edge in the market, easily and consistently. Option Samurai scans the whole market lightning-fast and integrates all the data you need to make the best decision and save time. Try it now for free.
Use coupon code “CYTdiscount2015” and save 20% for the life of your membership at OptionSamurai.com


