Apple & Netflix Case Study: Technicals Lead, Fundamentals Lag

Technicals Lead, Fundamentals Lag
Facebook
Twitter
LinkedIn

Conclusion: Technicals Lead, Fundamentals Lag.

 
This is a case study I performed in 2013.  The lessons still apply just as much today as they did then.
 
The following two case studies illustrate a very important point: The market and individual stocks (i.e. technicals) move months BEFORE the fundamentals move (up or down).  The reasons “why” are lengthy and outside the scope of this article. Instead of discussing the “why” we shall focus on the “what.” The reason is simple, we care about intelligently operating with “what is actually happening,” not why people think things are happening.
 
There are countless examples in history of markets and individual stocks turning months before the fundamentals turn. Every major top or bottom in the stock market happened months before the fundamentals turned.  Moral: The market always knows, ignore the market’s opinion at your own risk.
 
Apple (AAPL) and Netflix (NFLX) are two examples of the technicals turning months before the fundamentals turn.


Apple- AAPL: 

 
 Technicals Lead, Fundamentals Lag
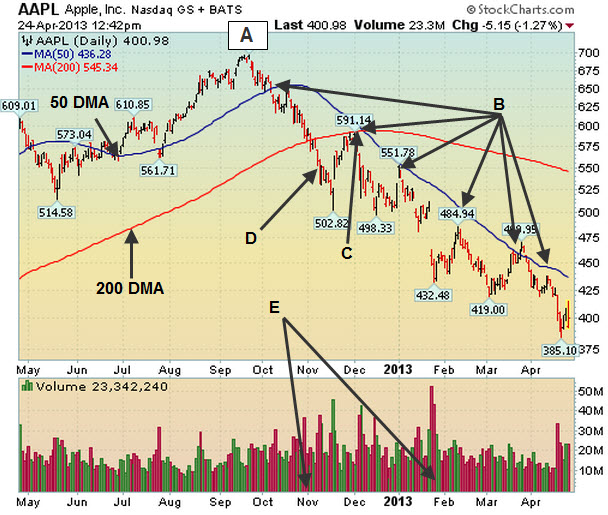
A. All-time high $705.07 on 9.21.12.
* 3-Months Before Earnings Flatten Out
*6-months BEFORE earnings turn Negative For The 1st Time In 10 years!
B. Breaks 50 DMA Line Almost Never Gets Back Above It
C. Death Cross- 50 DMA line Undercuts 200 DMA Line
D. Enters Bear Market: Defined by A >20% Decline from Recent High
E. Q1 2013 Earnings fall -18% which is the first year-over-year quarterly decline in 10 years.
 
Moral: The market always knows, ignore the market’s opinion at your own risk.
_________________________________________________________________
 

Netflix- NFLX:

 
 Technicals Lead, Fundamentals Lag
 
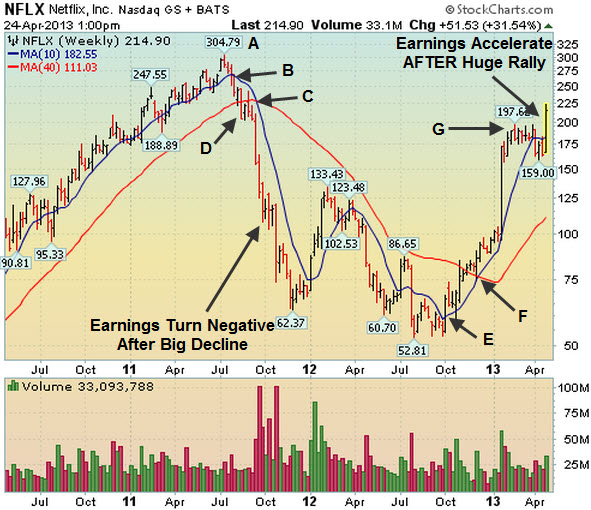
A. All-time high $304.79 July 2011
*6-months before earnings turned negative
B. NFLX Breaks Below 50 DMA line & stays below it for months
C. Death Cross: 50 DMA line Undercuts 200 DMA Line
D. NFLX enters bear market and then plunges 82.6% before bottoming!
E. NFLX Bottoms then jumps back above its 50 DMA line
F. Golden Cross: 50 DMA line crosses above 200 DMA line
G. Earnings Accelerate in Q1 2013 vs Q1 2012 AFTER a 300% rally off the low!
 
Moral: The market always knows, ignore the market’s opinion at your own risk.


Check out some of our other blog posts:

Facebook
Twitter
LinkedIn

Here are more articles you may like

Claim Your Free Guide Today

Give us your email and we will give you the tools to change your life. 

FREE 7 DAY EMAIL COURSE

Learn about Early Entry Points & much more...

© ChartYourTrade | Contact us: website@chartyourtrade.com

Disclaimer: All communication from ChartYourTrade is general in nature and for educational and general informational purposes only. Under no circumstance should it be considered personalized investment advice. All our work is general in nature and not specific to any one person. All the information on this site and/or that originates from us, or any of our partners or affiliates, is for educational and informational purposes only and is NOT a recommendation to buy or sell anything. To avoid any conflicts of interest, we do not have a working relationship with any of the companies mentioned in our work. Furthermore, we may have a long, short, or no position in any, or all, of the names that appear in our work and they may change at any time without notice. Investing and trading in capital markets or using margin carries a high level of risk and may not be suitable for all investors. Leverage can work against you as well as for you. Before you decide to invest or trade in capital markets you should carefully consider your investment objectives, level of experience, and risk appetite, among other factors. The possibility exists that you could sustain a loss of some, all, or more of your initial investment and therefore you should not invest money that you cannot afford to lose. You should be aware of all the risks associated with capital markets, investing/trading, and seek specific investment advice from an independent financial advisor and other professionals. Remember all the information we provide is for educational and general informational purposes only and is subject to change without notice.

Charts and Data are courtesy of MarketSmith Incorporated. Join MarketSmith here.

Terms of Service